|

|
|
Insider TA: P&F Support & Resistance LinesAfter enabling Point & Figure charting and selecting the beginning reference point, you can add Support & Resistance trend lines. Because Point & Figure charts ignore the time factor and focus exclusively on price movement, they can be helpful in marking significant price formations. Bullish or bearish activity is implied when these formation levels are penetrated, reflecting how seller emotions (fear) and buyer emotions (greed) are competing with each another.
In addition to purely horizontal orientations, the tops and bottoms of columns may also be observed to appear at 45 degree angles. Mapping these patterns are more commonly referred to as trend lines, although we tend to refer to them as support & resistance lines as well. Interestingly, this 45-degree behavior is prevalent with many stocks, which makes Point & Figure charts so fascinating! Regardless of whether lines be horizontal or angled, when a column of upward bound X's penetrates a resistance line, or downward O's penetrates a support line, it may indicate a signficant price movement is about to occur. Adding a line: Referring to steps marked 1, 2, and 3 in the following figure, to add a line all you have to do is left-click the mouse button anywhere in the Point & Figure graph, and then drag the mouse in the desired direction. Depending on where you're dragging the mouse, the line will "snap" to either zero degrees (horizontal) or 45 degree up or down. These three orientations are the conventional Point & Figure methods for illustrating support and resistance trend levels. Moving or Repositioning a line: Referring to step 4 below, changing an existing line is achieved by dragging the "handles" at either endpoint:
To remove a Support & Resistance line, right click either of it's endpoint handles. A menu will popup, allowing you to select the first option titled "Delete this line". You will also see a second option that lets you delete all lines instantly. Refer to step 5 below. 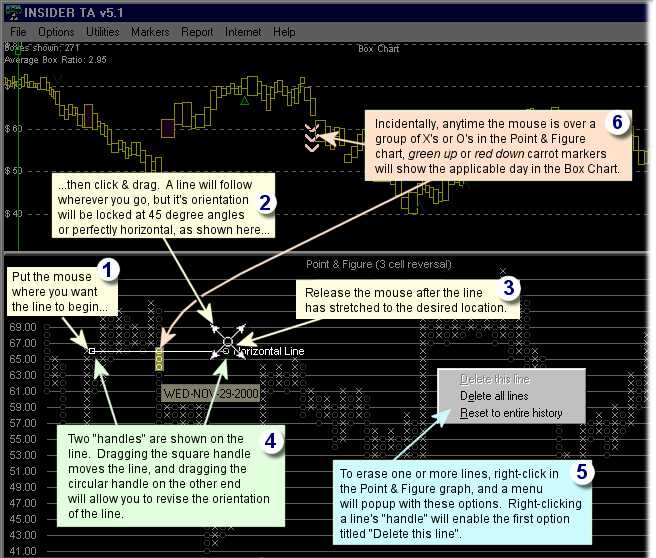
|
|
Copyright ©1995-2026 Stock Blocks® |
|