|
Ok, so you're not sure where to start. Here are a few pointers that should
set you in the right direction. If you have any questions, you can email
us at support@stockblocks.com.
Popup Help
 Insider TA (ITA) has
the conventional popup help facility. It does not require an Internet connection -- all the help is
installed locally to your system. The help system is context-sensitive, meaning
that whereever you see a help button, clicking it will advance to the appropriate page.
As an added convenience, observe a "?" button in the lower left region of the main window
(it is next to a button showing a stoplight icon). Click the "?" button
and the mouse will turn into a question mark. In this mode, now click anything in Insider TA's main window
to popup a help window that is dedicated to whatever you clicked. Insider TA (ITA) has
the conventional popup help facility. It does not require an Internet connection -- all the help is
installed locally to your system. The help system is context-sensitive, meaning
that whereever you see a help button, clicking it will advance to the appropriate page.
As an added convenience, observe a "?" button in the lower left region of the main window
(it is next to a button showing a stoplight icon). Click the "?" button
and the mouse will turn into a question mark. In this mode, now click anything in Insider TA's main window
to popup a help window that is dedicated to whatever you clicked.
Load the Demo Data:
 To Load a demo file for viewing, click
the button at the base of the screen labeled "Load Data". The File Entry Panel
will pop up. On the left side, you will see an entry titled "Sample Demo data".
Click that line and all the demo files in that folder will be displayed in the
File Menu on the right side. Click the desired entry to load the data.
To Load a demo file for viewing, click
the button at the base of the screen labeled "Load Data". The File Entry Panel
will pop up. On the left side, you will see an entry titled "Sample Demo data".
Click that line and all the demo files in that folder will be displayed in the
File Menu on the right side. Click the desired entry to load the data.
And where to go after data is loaded..
What do you do after data is loaded into Insider TA? This is a matter
of personal choice, but here are some suggested steps...
- Optimize the BA Yield
- Configure the VA Rank
1. Optimize the BA Yield
 Step
#1.1: Step
#1.1:
The first thing you should always do is optimize the Box Analyzer (BA).
Turn on the three number spinners in the lower left corner: the red Mov
Ave, green BA Ave, and
green BA Tag. You will observe when
the BA AVE is turned on, a Box
Analyzer (BA) graph is activated.
Step #1.2:
Now click the button above these three number spinners labeled "Optimize
BA". Wait a few seconds while INSIDER TA optimizes their values to the
best possible yield. When completed, observe the "BA % Yield" in the
lower left corner of the BA Graph, and evaluate the accuracy of the green
BUY and SELL tags in the box chart.
Click here for more information
on effective use of BA yield analysis.
2. Configure the VA Rank
Step #2.1:
  Another
task you can perform is put a VA Line in the graph. Click the "VA LINE" button,
and observe how the mouse icon changes to " Another
task you can perform is put a VA Line in the graph. Click the "VA LINE" button,
and observe how the mouse icon changes to " ".
Now click somewhere towards the beginning of the box chart* (the
vertical position does not matter). This will generate a VA Line, which
is plotted in a light blue color. ".
Now click somewhere towards the beginning of the box chart* (the
vertical position does not matter). This will generate a VA Line, which
is plotted in a light blue color.
|
* Tip: If
the beginning of the graph is out of view, then right-click
the Viewer Pan Left button to "snap" the viewport to the
left-most end.
The Viewer Pan Left button is in the Viewer Control
Panel, shown here.
|
 |
Step #2.2:
 Observe
how the "VA LINE" button has changed appearance. If the resulting VA
Line interferes with other items in the graph (specifically, the yellow
boxes), you can shift it up or down by spinning the thumbwheel that is
now attached to this button. Observe
how the "VA LINE" button has changed appearance. If the resulting VA
Line interferes with other items in the graph (specifically, the yellow
boxes), you can shift it up or down by spinning the thumbwheel that is
now attached to this button.
To remove the VA Line, click the main button, but don't do that now
if you plan on continuing with the following steps.
Tip:We like stocks whose VA Line is trending upwards.
This corresponds to a Up Volume to Down Volume (UV/DV) ratio greater
than 1.0.
Step #2.3:
 Now use the
stretch, compress, zoom and pan buttons in the Viewport Control Panel to
manipulate the graph to your desired perspective. Now use the
stretch, compress, zoom and pan buttons in the Viewport Control Panel to
manipulate the graph to your desired perspective.
Step #2.4:
 Turn
on the three number spinner switches labeled Rank
Win, Rank:Buy%, and Rank:Sell% (put
a checkmark in the boxes, as shown here). This activates the VA Rank Function graph
("VA" stands for "Volume Analyzer"). Turn
on the three number spinner switches labeled Rank
Win, Rank:Buy%, and Rank:Sell% (put
a checkmark in the boxes, as shown here). This activates the VA Rank Function graph
("VA" stands for "Volume Analyzer").
Step #2.5:
You can now adjust the number spinners from the previous step. Increase or decrease the dispalyed value in the
Rank:Buy% control.
While you are doing this, observe the horizontal position
of a line labeled "Buy @ __%" move
in the VA Rank Function graph. Your goal is to position the "Buy
@ __%" line so that it pierces the tips of any major peaks
that are observed in the purple VA Rank line.
Now repeat the above process for the Rank:Sell% button,
but now try to position the "Sell @ __%" line
so that it pierces the valleys in the purple VA Rank Line. An example of this is the following:
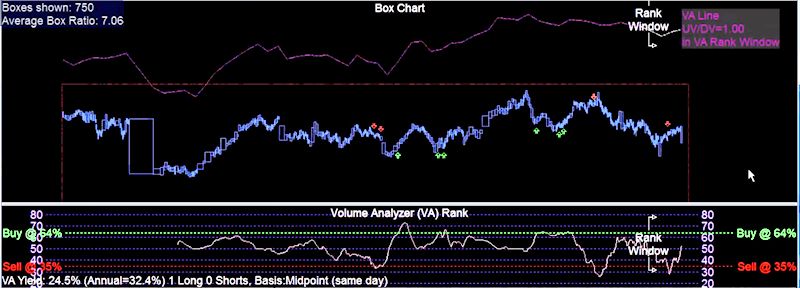
Step #2.6:
The two lines you positioned in the above step are VA Rank threshold
levels.
- Whenever the purple VA Rank function rises above the "Buy" line,
you will observe a VA Rank BUY tag is generated. These
are green arrows in the box chart pointing up.
- Similarly, whenever the VA Rank function falls below the "Sell" line,
a VA Rank SELL tag is generated (red arrows pointing
down).
Evaluate the positions of BUY and SELL tags overall. If
they are well placed, you have a good model for future activity. Like
any technical analysis method, the system is not 100% perfect (note some
of the tags in the above figure were not good predictors). Historically,
the VA Rank buy tags tend to be more accurate than the sell tags. We
consider the VA Rank function is best used as a confirmation tool to
other analysis methods, such as the Box Analyzer.
Click here for more information
on VA Rank analysis.
After completing the above steps 1 & 2...:
Keep all the switch settings from the above steps where they are! Insider
TA remembers them, and automatically restores them the next time you
load this particular stock.
The concept is simple: if the BA and VA RANK produced accurate buy and
sell tags throughout your historical data, you will have a nice system
of indicators that can aid in the forecasting of future price moves.
Scanning the Demo Data
From here, you can play with the File Scanner. As you will see, the
File Scan Utility can BA Optimize your entire portfolio automatically.
The following steps show you how to scan the demo files...
 Click the File Scan button (shown here to the left) at the base of
Insider TA's main window.
Click the File Scan button (shown here to the left) at the base of
Insider TA's main window.
- The File Scan Panel appears, which has three tab pages: Setup, Targets, and Results.
The Results page is where all your scanned output will eventually
get deposited.
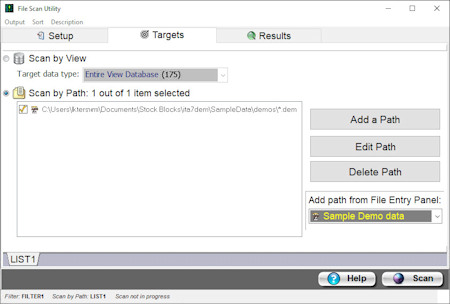 Click the 2nd tab page titled "Targets", then make sure the "Scan by Path"
radio button is checked .
Click the 2nd tab page titled "Targets", then make sure the "Scan by Path"
radio button is checked .
- Pulldown the menu titled "Add path from File Entry Pane". You should see a listing in this pulldown that
specifies the path "Sample Demo Data".
Click this entry to add it to the list box. Observe an empty checkbox next to this entry.
Click it to insert a checkmark. This activates that path for scanning.
Note: You could also add paths by clicking the "Add A Path" button,
but this is not necessary in your case because all demo files are contained
in a single directory.
- Now return to the first tab labeled "Setup". This
will pop up the Filter Panel, which is where you specify
the desired scanning options.
|
