|
|
Insider TA's Stoploss and Trailing Stop Methods
| INSIDER
TA Pro supplements its BA and VA
RANK trading signals by offering Stop Loss and Trailing
Stop exit signals. Volume has no influence on the generation of these
signals. They are governed exclusively by price movement, and are generated
against BA and
VA
RANK "buy" and "sell" tags only. They are not inserted for
actual transactions that you log into the system.
NOTE: These functions are
fully supported in the Pro Version. For demonstration purposes,
it remains integrated in the Standard and Demo
versions, but is limited to working with demo files.
|
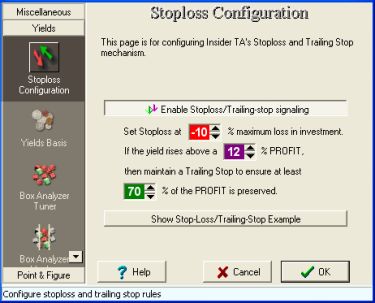
The Stoploss/TrailingStop parameters
are adjusted in the "Stoploss Configuration" panel in the "Yields"
section of the CONFIG OPTIONS panel. As you can see, it comprises three
switches, and all represent percentage values.
-
The red switch (set here to -10%) represents
the stoploss setting.
-
The purple switch (12%) represents the minimum
desired profit.
-
The green switch (70%) is the percent savings
factor.
The example that follows uses these switch
settings. |
 |
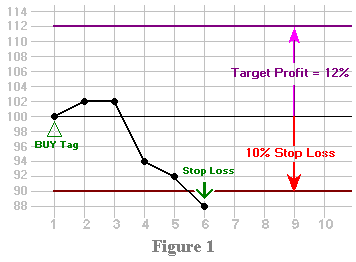
| Stoplosses
A stoploss tag occurs at some point
after a buy tag whenever the price midpoint falls a certain percentage
below the buy point.
For simplicity, let's presume a BA buy
tag was generated at $100 (see Figure 1). Let's also say we anticipate
a 12% profit, but if we're wrong and the stock price falls, we want to
diminish our losses by setting a stoploss level at -10%. This means a stoploss
signal will be generated if the price midpoint ever drops below $90 (10%
of $100 is $10; $100 minus $10 equals $90). This is observed on day #6
in Figure 1.
On the other hand, if the stock price rises
up and beyond our 12% threshold, then a trailing stop would be implemented. |
|
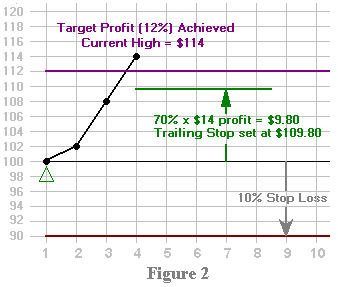
| Trailing Stops
A trailing stop is intended to protect
the profit already achieved, but only after the price midpoint reaches,
or rises above, a preset "target" profit level. In our example, our
target profit is 12% which, for a $100 buy, is $112. This is marked by
a horizontal purple line in Figure 2.
Our goal is to maintain some percentage
of our profit at all times (any value between 5% and 95% is acceptable,
but lets say we select 70%). This will be used to determine the trailing
stop level.
On Day #4, the price midpoint hit $114,
exceeding our 12% threshold, so a trailing stop level is initialized to
70% of the $14 profit. Observe the green trailing stop line at $109.80
in Figure 2.
Note that after a trailing stop
is activated, the original stoploss level is no longer applicable. |
|
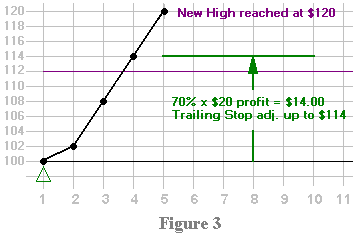
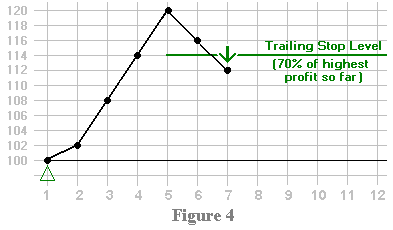
| In Figure 3, on day #5 , the
price rises even higher to $120. In order to protect 70% of this
higher profit ($20), the trailing stop level is adjusted to $114.
The process repeats itself if the price
continues to climb, but... |
|
| ...should the price fall below
the current trailing stop level, as seen on day #7 in Figure 4, then a
trailing stop tag would occur, thus protecting a percentage of the profit
seen so far. |
|
|
|
